Catherine K.
Aug 28, 2018
Read time: 7 minute read
With Google Maps' recent price hike, you may be considering switching to Mapbox. This post is a brief overview of how we made the switch for a client site.
After the recent Google Maps price hike, one of our clients needed to find a new maps provider for their flagship site, and selected Mapbox. For more information on why they chose Mapbox, check out our previous blog post "Switching to Mapbox: the Less Expensive Google Maps Alternative".
In this post, we’ll cover a brief overview of how to switch from Google Maps to Mapbox, using a client travel site as an example. The whole process took less than two weeks, with the majority of that time spent on research and deciding how we wanted the markers to look (sometimes it’s the little things, isn’t it?). The implementation and functionality were the simplest, quickest parts.
Initializing a map with Mapbox is simple. For our client travel site, we called the new mapboxgl.Map() function and passed in a few options:
The container where the map will go
The style for the map to use — which can be a premade style or a custom style made in Mapbox studio
The center of the map
And the initial zoom level for the map
var map = new mapboxgl.Map({
	container: 'dynamic-map', // HTML container id
	style: 'mapbox://styles/mapbox/outdoors-v10', // style URL
	center: [-153.369141,66.160507], // starting position as [lng, lat]
	zoom: 3
});
Just make sure you load your access token ("mapboxgl.accessToken = your_token;"), and you’re ready to add markers and data to your map.
Using a Layer
There are several ways to create a map and add markers with Mapbox. For our client travel site, the best option was to use Mapbox GL JS to create a Layer. By using a Layer, we were able to create all our custom markers, their event listeners, and their popups in one go. To create a Layer, we needed to create a GeoJSON object for its data source.
Using GeoJSON as the Data Source
GeoJSON is a JSON-based a data format used to represent geographical data. In Mapbox, you can add a GeoJSON object to your Layer as a data source so it knows where and how to put the items on the map. If your site’s map setup already uses GeoSJON, great! Just plug it in to the Layer, add some styling options, and add your Layer to the map.
Our client travel site wasn’t using GeoJSON to create their Google Maps. Instead, they had a CMS-generated list of entries that each represented a location. Each entry had coordinates and an id as data attributes. Each one also had a sibling-level DOM node to be used as that entry’s marker popup. It created a marker by feeding the coordinates into Google Maps’ "new google.maps.LatLng" method and creating a "new MarkerWithLabel" with the result. It then added the popups and event listeners to the markers.
To convert that setup to Mapbox, we created a function that got each entry’s coordinates, id, and popup content and assembled a GeoJSON “Feature” object with it.
The Feature object was then passed in to the GeoJSON object. When the GeoJSON object was assembled, we passed it in to the Layer as a data source. The next step was to create custom markers in the Layer.
Adding Custom Markers
Our custom markers needed to use the same image the travel site was already using (a .png), with text representing the marker’s entry’s index inside the marker. To create our custom markers, we loaded our custom marker image and added it. Then we gave the Layer a type of “symbol.” (There are many types of Layers, like “heatmap” or “line,” but we only wanted to add marker symbols to our map.) Next, we passed the image in as the “icon-image” in the Layer’s “layout” object.
Having a Layer is also helpful for creating interactivity. When the User clicks or interacts with the map, you can query a Layer to see if something in that Layer’s data source was interacted with. If so, you can animate the map or run other functions for that feature. In the case of our client travel site, the only Features are markers, and the only layer is called ‘markers’. If the clicked point on the map has a marker, we create a popup and zoom/pan in on the clicked marker.
map.on('click', function(e) {
  var features = map.queryRenderedFeatures(e.point, { layers: ['markers'] });

  if (features.length) {
    var clickedPoint = features[0];
    map.flyTo({
      center: clickedPoint.geometry.coordinates,
      zoom: 15,
      speed: .75
    });
  }
});
Without a Layer
One of the great features of Mapbox is that there are often several ways to use it. If you don’t have lots of data to add to the map, if you don’t want custom markers, or if you just prefer the default markers, then you probably don’t need to add a Layer. If that’s the case, check out this tutorial on how to switch from Google Maps to Mapbox.
Demo
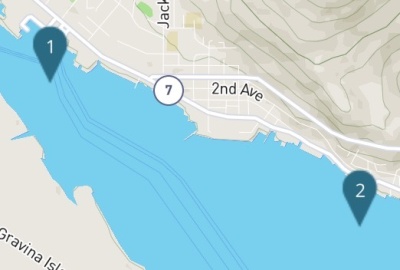
Here’s an example of how our client travel site’s map worked after converting to Mapbox
This demo features the custom markers (with image, text, and styling) created in GeoJSON, the layout options (such as marker overlap) from the Layer, and the popup and flyTo functionality described in the tutorial above.
Our client travel site also features additional, more complex, functionality that’s similar to this tutorial, but the info above covers the basics of how to we converted a Google Maps setup to Mapbox.
I hope this article has been helpful, whether you’re considering switching from Google Maps to Mapbox or whether you’ve already started the process. If you still need some convincing that Mapbox is a great Google Maps alternative, check out our previous blog post, "Switching to Mapbox: the Less Expensive Google Maps Alternative." Happy coding!
We’ve discontinued CP Filters for Craft CMS 5. Lab Reports and Link Vault will be updated. We still use Craft, and want to focus on creating great websites for our clients.
Shopify's Dawn theme homepage may get an SEO warning for an empty h1 header element. This is a missed opportunity to help search engines understand what your page is about. Small edits to the theme code can fix this technical SEO issue.
Shopify's default Dawn theme displays empty alt tags for collection images. This post explains how to fix blank alt tags for Shopify collection images to improve your Shopify store's accessibility and SEO.
Subscribe to Our Newsletter
A few times a year we send out a newsletter with tips and info related to web design, SEO, and things you may find interesting.